

In partnership with

Happy Sunday. I can’t help but wonder whether the financial cushion consumers have been leaning on is wearing thin. In Canada, this week’s GDP numbers confirmed that the economy is barely moving. At the household level, the strain is becoming harder to ignore: savings rates are collapsing, credit card delinquencies are climbing, and Canadians are turning to crowdfunding just to cover rent and groceries. That last one, in particular, tells you something is seriously broken. I’ll take a deeper look at each of these stories in this week’s Pulse.

Market Recap: U.S. and Canada
I’m going to call this a very strong week for equity markets, with tech leading the way and gains holding across all four major indices. The Nasdaq 100 separated itself from the pack early and never looked back. The TSX was the notable outlier, briefly dipping into negative territory mid-week before recovering, ending the week with a modest but positive result.
As for the numbers, the Nasdaq 100 led with a gain of 3.32%, followed by the S&P 500 at 1.80% and the Dow Jones Industrial Average at 1.49%. The iShares S&P/TSX Capped Composite ETF (XIC) brought up the rear with a 0.76%. Last place, yes, but still not too shabby.

Week ending May 29, 2026
Major Economic Stories This Week
Core PCE Cools Slightly But Drifts Further From Target
Monthly core PCE came in below forecast, but the annual rate ticked up to 3.3%.

Monthly core PCE eased to 0.2% in April, slipping from March’s 0.3% and coming in a hair below expectations. Year-over-year core PCE, though, actually accelerated from 3.2% to 3.3%, drifting further from the Fed’s 2% target. The monthly trend is moving in the right direction, but it’s moving slowly, and the annual rate is still running 130 basis points above where the Fed wants to see it. Until monthly readings consistently land at 0.1% to 0.2%, the annual rate won’t follow at a pace that gives policymakers room to act.
March monthly core PCE: +0.3%, upwardly revised from the initial estimate
Annual consensus: +3.3% matched forecasts exactly; the miss was on the monthly reading only
Gap to Fed target: widened by 10 basis points month-over-month, from 120bp in March to 130bp in April
Annual core PCE has not been at or below 2% since early 2021
Durable Goods Orders Spike In April, But The Details Tell A Different Story
New orders jumped 7.9% in April to $346 billion, driven almost entirely by a 165.9% spike in non-defence aircraft orders.

The headline looks like a manufacturing surge, but it isn’t. Non-defence aircraft orders nearly tripled in a single month, but it’s a category so volatile that analysts often strip it out before drawing any conclusions. When we do that, orders rose 1.1%, matching March’s pace exactly, steady but unremarkable. The broader picture is mixed: fabricated metals, primary metals, and machinery all posted gains, while computers and electronics slipped 0.7%. The number that matters most for business investment intentions, core capital goods excluding both defence and aircraft, fell 1.1% in April after a strong 3.9% gain in March.
March orders: upwardly revised to +1.3%, raising the base for April’s comparison
Transportation equipment overall: +21.5%; ex-defence orders: +8.1% after a -0.3% prior-month decline
Fabricated metal products: +3.5%; primary metals: +1.9%; machinery: +0.5%
Capital goods orders overall: +21%, concentrated almost entirely in non-defence aircraft
Income Stalls While Spending Holds
Personal income was flat in April as farm subsidy payments dried up, and real consumer spending rose just 0.1%.


Income came in flat for April, missing the 0.4% forecast, largely because a $61.7 billion drop in farm proprietors’ income hit the total after applications closed for the Farmer Bridge Assistance Program. That’s a one-time distortion, and we shouldn’t take it as a signal about wages. Salaries and compensation actually grew $32.4 billion, with private sector wages up $28.5 billion. On the spending side, the 0.5% nominal gain looks reasonable, but energy is doing most of the work: gasoline and energy goods accounted for $28.8 billion of the $44 billion increase in goods spending. Strip out inflation and real consumer spending rose just 0.1%, a sharp step down from March’s upwardly revised 0.3%. Real disposable personal income fell 0.5% on the month, deepening a trend that has now run two months negative.
Nominal disposable personal income: -0.1%, or $19.9 billion, following a +0.5% gain in March
Services spending: +$67.2 billion, led by housing and utilities ($22.7 billion) and recreation services ($12.1 billion)
Motor vehicle spending: -$9.2 billion, the only major goods category to decline on the month
March personal spending: upwardly revised to +1.0%, raising the prior-month comparison base
TOP INSIGHTS
Consumers Are Spending Money They Don’t Have
April’s data shows a consumer that is still spending, but we’ve never seen more evidence that the foundation underneath that spending is eroding. Income was flat, real disposable income fell 0.5%, and yet nominal spending rose 0.5%. That gap has to be filled by something, and right now it’s being filled by savings drawdowns and credit. What makes it worse is the composition. A significant chunk of the goods spending increase came from gasoline and energy, which isn’t a choice. Households aren’t spending more because they feel confident. They’re spending more because fuel costs are forcing their hand.
When energy consumes a larger share of a household’s budget, trade-offs emerge everywhere else. Discretionary categories get cut first: restaurants, retail, entertainment. The data already hints at this, with real spending rising just 0.1%, meaning the nominal gain was almost entirely inflation-driven, and for businesses that depend on discretionary consumer dollars, that distinction really matters. A consumer who is technically spending but doing so entirely on necessities is not the same engine of growth as one spending freely.
My read is that this is going to show up more clearly in the May and June data. The farm income distortion gave April an artificial floor, and without it, the income picture would have looked even weaker. If energy prices stay elevated and wage growth doesn’t accelerate, real consumer spending is headed lower. The cushion that carried households through the past two years is thinner than it’s been in a long time, and I predict we’re on the verge of the true story finally coming to light.
The Durable Goods Headline Is Almost Entirely Noise
A 7.9% spike in durable goods orders sounds like industrial momentum building, but it doesn’t hold up under scrutiny. As noted, non-defence aircraft orders jumped 165.9% in a single month. Keep in mind that this is a category driven by the irregular timing of large commercial orders that can be placed or deferred in ways that have nothing to do with underlying demand conditions. Treat the headline as signal at your own peril.
If we strip out transportation, orders rose 1.1%, which is solid and consistent with March. The more important data point is core capital goods, which excludes both defence and aircraft and serves as the best available proxy for real business investment intentions. That fell 1.1% in April after a strong report in March. In an environment that’s already clouded by trade uncertainty and tariff risk, businesses pulling back on capital commitments should be taken as an early sign of caution rather than confidence.
If core capex continues to slip in May and June, it starts to look like businesses are genuinely pausing investment decisions until there’s more clarity on the trade environment. That would have real implications for productivity and growth further out, and it’s exactly the kind of slow-building risk that doesn’t make headlines until it’s already embedded in the data.
The Fed Is Trapped Between A Cooling Month And A Rising Annual Rate
April’s 0.2% monthly core PCE reading was below forecast and below March, and on the surface the most encouraging inflation print in several months. That’s the good news. But the annual rate moved from 3.2% to 3.3%, accelerating rather than decelerating. That’s the not-so-good news. That combination pretty much sums up the Fed’s dilemma in a single data release. Monthly progress is welcome, but the annual rate says more about where you actually are, and right now that number is moving in the wrong direction.
For the Fed, this print is neither a reason to cut nor a reason to hike. It’s a reason to wait, and that’s exactly the position they’ve signalled. A 0.2% monthly reading is still above the monthly pace needed to sustainably bring annual core PCE back to 2%. Until there are two or three consecutive readings at or below 0.2%, the annual rate won’t respond enough to justify a change in posture.
Here’s what I’m watching. I want to see whether April’s print is the start of a legitimate disinflation sequence, or a one-month dip before monthly readings drift back toward 0.3%. Given that energy prices are still elevated and services inflation has shown little inclination to break, I lean toward the latter. Rate cuts this year look increasingly unlikely, and the more likely scenario is that the Fed holds through year-end.
The 10 Best Cheap Stocks to Buy Now

The market is expensive… historically expensive.
Most of the biggest stocks are already fully priced. Capital has crowded into the same mega-cap names — making true value harder and harder to find.
By early 2026, institutional money had stayed concentrated. Smaller companies had been overlooked. And beaten-down names had been left behind.
But here's the real question…
When the broader market is this expensive — which stocks are still cheap enough to offer real upside?
Our new report reveals 10 undervalued stocks trading under $10 per share — from companies too small for institutional money managers to touch… to out-of-favor names already working their way back.
If you're looking for real value in an overpriced market, start here.
TOP CONSUMER
The American Consumer Is Running On Empty

Savings rate has collapsed to a 22-year low
Credit card delinquencies at highest level since 2011
401(k) loans and hardship withdrawals are climbing
Lower-income households cutting gas consumption to cope
I chose this as this week’s top story, and as I mentioned in the Insights section, the consumer spending gravity-defying magic act is really starting to look fragile.
The data that came out this week paints a worrying picture: American consumers are still spending, but the buffers they’ve been leaning on are nearly gone. As I noted in the economic update above, real disposable personal income fell 0.5% in April and real consumer spending rose just 0.1%. Now layer in what’s happening beneath those headline numbers, and the picture gets harder to ignore.
The Savings Rate Is The Number That Should Worry You
The personal savings rate fell to 2.6% in April, down from 3.6% in March and 5.5% a year ago. That’s now the lowest level in two decades. Navy Federal Credit Union’s chief economist Heather Long put it bluntly: the larger tax refunds that have been keeping some households afloat will be exhausted by July. Credit card delinquencies have hit their highest level since 2011, with about 13% of all accounts in arrears. Meanwhile, 19.2% of Fidelity 401(k) accounts now carry outstanding loans, and hardship withdrawals have climbed to 2.5%. Households are raiding tomorrow to pay for today.
This Gets Worse Before It Gets Better
If these stats don’t get your attention, add this to the mix. Lower- and middle-income households are cutting gas consumption even as overall spending climbs, so that tells us that energy costs are crowding out everything else. Walmart’s CFO noted that customers are filling up with less than 10 gallons per visit for the first time since 2022. With GDP growing at just 1.6% annualized in the first quarter and real incomes on the decline, the margin for error is thin. If energy prices stay elevated through summer, belt-tightening in discretionary categories is almost a sure thing.
Read the full story here.

The data released this week makes it clear that American consumers are under real financial pressure, and the signals are showing up in multiple places at once. Whether it’s a savings rate that has collapsed to its lowest point in two decades, credit card delinquencies back at levels not seen since the aftermath of the financial crisis, or more households raiding their retirement accounts just to stay afloat, each of these tells part of the same story. I’m curious to know which signal our community finds most worrying for the economy ahead.
Please vote on this week’s question:
Which consumer stress signal concerns you most for the broader economy?
LAST WEEK’S POLL RESULTS
In last week's poll, I asked how you react when you hear that bond yields are rising. A clear majority, 75%, tune it out, while the remaining 25% pay close attention. Most of our community doesn't let yield headlines pull their focus, but I hope we’ll see that number change as time passes. Thanks to everyone who voted.

READER COMMENTS
I Pay Attention
"I pay very close attention to bond yields nowadays... To be fair, age has a little something to do with this and up until probably 5yrs ago, I paid little attention to bond yields. I've long understood the inverse correlation between bond yields and stock index prices, but it honestly wasn't a big focus of mine." — callawayguy
I Tune Out
"I wish I paid more attention to them. They are what drives our economy and decisions- invisible to us all- and yet ever so present in our daily lives. I hope to pay more attention and read up on it. Your articles give me a good medium to launch my search on" — kyiabelle1
"I do not understand bonds and their relationship to the stock market...I should try harder!" — mrrobpog
"i don't understand it as well as I might" — ldunbar08
THE ECONOMY
Canada’s Economy Has Stalled, And The Excuses Are Running Out

GDP contracted 0.1% annualized in the first quarter
Two consecutive negative quarters raises recession debate
Business investment has now declined for five straight quarters
April flash estimate points to a modest 0.4% monthly rebound
Canada’s economy contracted for the second consecutive quarter to start 2026, shrinking 0.1% on an annualized basis between January and March. That follows a 1.0% decline in the fourth quarter of 2025. Two consecutive quarters of negative growth is often taken as the definition of a technical recession, but most economists are cautious about applying that label at this point, given the small magnitude of the first-quarter decline and the possibility of upward revision. That said, what’s harder to argue with is the trend: the economy has now contracted in three of the past four quarters.
The Weakness Is Broad, And Business Investment Is The Core Problem
The first-quarter contraction was driven by weak investment and a surge in imports, which subtract from GDP. Government capital investment fell 2.5%, while business capital investment declined 0.7%, its fifth consecutive quarterly decline. The soft housing market added to the drag, with resale activity down 9.9% in the quarter. Exports fell 0.1% as tariffs reduced Canadian vehicle shipments to the US, while imports rose 2.9%. Consumer spending grew 0.4%, but economists at CIBC noted that consumers have “little ammunition left for spending ahead.” The Bank of Montreal’s chief economist Douglas Porter called the report weak from most angles, adding it should “throw a wet blanket on rate-hike talk.”
The Bank Of Canada Is Now Firmly On Hold
The Bank of Canada has held its policy rate at 2.25% for four consecutive decisions, balancing upside inflation risk from the oil price shock against downside growth risk from trade uncertainty. These latest GDP numbers reinforce the case for staying put. Financial markets had been pricing in one quarter-point hike by December, but that call looks increasingly unlikely. An April flash estimate showing 0.4% monthly growth does offer some relief, but with the USMCA review looming and business investment in a multi-quarter slump, a serious recovery is far from guaranteed.
Read the full story here.
THE CONSUMER IN CRISIS
Canadians Are Crowdfunding Their Bills, And That Should Alarm Us

Essential needs fundraisers up 7% year-over-year through April
Monthly bills campaigns have risen 10% compared to 2025
Mortgage delinquencies up 52% in Ontario and 36% in B.C.
More than 4.5 million Canadians lived below the poverty line in 2024
I promise this is the last ‘bad news about the consumer’ story for this week. But it is something that we shouldn’t ignore. The GoFundMe platform was built for medical emergencies and community causes, but it’s now becoming a bill-payment platform. Between January and April 2026, nearly 12,000 fundraisers for essential needs, covering rent, mortgage, and utilities, were created, a 7% increase over the same period last year. Campaigns for monthly bills rose 10% year-over-year, following a 15% rise through all of 2025. The trend has been building for two years, and it’s accelerating.
Affordability Has Moved Past A Housing Problem
University of Toronto housing researcher Carolyn Whitzman described “a growing amount of desperation in Canadian households,” and she points to a housing crisis that is pushing more people to within one paycheque of homelessness. Mortgage delinquencies rose 52% year-over-year in Ontario and 36% in B.C. according to Equifax Canada’s latest consumer credit report. StatCan data shows more than 4.5 million Canadians, more than one in ten people, lived below the poverty line in 2024. Meanwhile, inflation hit 2.8% in April, a nearly two-year high, with gas prices up 28.6% year-over-year as the Iran conflict continues to disrupt global oil markets. As we just saw in the economic update above, those energy costs are hitting lower-income households hardest.
GoFundMe Is A Symptom, Not A Solution
Academics interviewed for this story were clear about what the trend represents. McMaster’s William Huggins called GoFundMe a “21st century Band-Aid,” useful in the short term but no substitute for structural fixes to housing and social support systems. University of Manitoba professor Shiu-Yik Au was blunter: “I don’t want to live in a world where people have to go online and basically do a song and dance for strangers in order to get enough bread to eat and pay their rent.” Over the past five years, more than $1 billion has been raised for Canadian causes through the platform. If that doesn’t capture your attention, I’m not sure what will.
Read the full story here.
This week’s poll results say most of our readers tune out when they hear about bonds. Hopefully, this week’s video will help you understand a bit better.
Watch the video here.


Did Trump take tomato? Here's what's behind the latest grocery price sticker shock
Tomato prices were up 21 per cent in April compared to a year earlier, the highest year-over-year price increase for any grocery item measured in the consumer price index, beating coffee and beef.

Rebuilt cars are cheaper than other used vehicles. But it's buyer beware
With the price of used vehicles up around 48 per cent since late 2019, a vehicle that's been rebuilt after a write-off may carry a tempting price tag. But auto industry experts say they carry risks that may affect safety and insurance.

Bond Trader Bets on Fed Hike Poised for Gut Check From Jobs Data
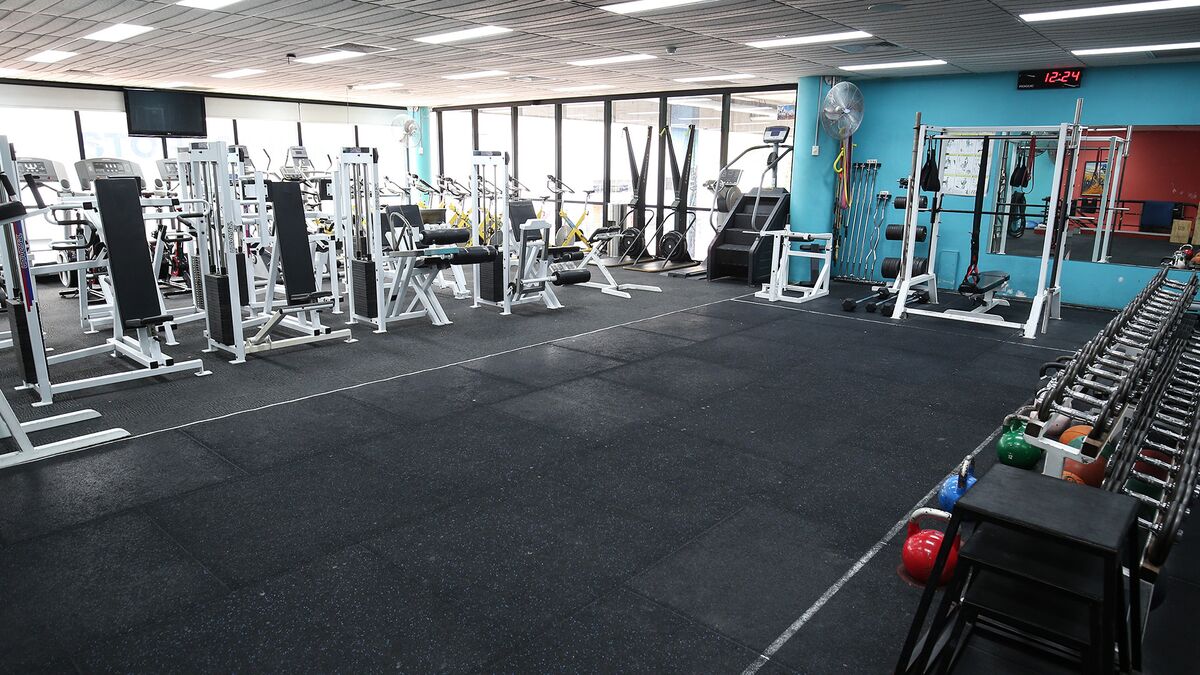
Gen Z Swaps Bars for Barbells






Week ending May 29, 2026 | Market Cap > $10 Billion USD

Week ending May 29, 2026 | based on 14-Day RSI | Market Cap > $10 Billion USD
The Relative Strength Indicator (RSI) can provide a signal that suggests a stock is either overbought or oversold.
📈A stock that has an RSI over 70 is considered to be in “overbought” territory. This might suggest that the stock is due for a pullback, however it is not a recommendation to sell.
📉A stock that is trading with an RSI below 30 is considered to be in “oversold” territory. This might suggest that the stock is due for a recovery, however it is not a recommendation to buy. Always perform your own due diligence.
