

It's Sunday, November 8, 2026. Prime Minister Mark Carney's second budget is counting on an oil windfall to fund housing, homelessness and Canadian sovereignty, even with the deficit above C$50 billion. Tesla is winding down the Cybertruck to make room for robotaxis, a strong US jobs report hides a growing pool of long-term unemployed workers, and Trump Media's retail shareholders are counting more than $2 billion in losses. And oh yes, it was a wild ride in the markets this week. Let’s cover it all right here, right now.

Market Recap
It was a huge week in US politics, and the markets reacted with huge swings. Stocks jumped on Wednesday after Democrats won both chambers of Congress, and then gave it back on Thursday in the sharpest tech sell-off since April 2025, as worries about tighter AI rules hit chipmakers. Friday's strong US jobs report brought a partial bounce, and the TSX held up best on a rally in gold miners.
As for the numbers, the TSX was the only one of the four major indices to finish the week higher, up 0.47%. The Dow Jones lost 0.94%, the S&P 500 fell 2.68%, and the Nasdaq 100 dropped 4.91%.

Stocks in the Spotlight
AppLovin ($APP) gained 71.2% this week after third quarter revenue climbed 55% to US$2.19 billion and the company guided fourth quarter revenue as high as US$2.4 billion. Net income rose even faster, up 72% to US$1.44 billion, which works out to roughly 66 cents of profit on every dollar of sales.
Celestica ($CLS) fell 20.9% this week, including a 13% drop on Thursday when the AI and semiconductor sell-off spread to Canadian tech. The Toronto-based data centre hardware maker led the TSX's tech sector lower that day, a group that lost 5.4% as the broader index shed 736 points.
Wheaton Precious Metals ($WPM) rose 18.3% this week as gold had its best day since August on Wednesday and the company reported record year-to-date production, revenue and cash flow. Third quarter output rose 13% from a year earlier to 231,000 gold equivalent ounces, and operating cash flow came in at US$645 million.
Airbnb ($ABNB) gained 15.6% this week, most of it on Friday after third quarter revenue grew 19% to US$4.87 billion, its fastest pace in three years. Management also raised its full-year outlook, and CEO Brian Chesky told investors the company is back in growth mode.
Shopify ($SHOP) slipped 4.5% this week after an 8% drop on Tuesday, when third quarter revenue grew 32% to US$3.74 billion but plans for heavier holiday spending worried investors. Management expects fourth quarter operating expenses to rise to 29% to 30% of revenue, even as it guided for revenue growth in the low 30% range.
Economic Vital Signs
THE QUICK READ
This week's data showed a divergent picture of North American labour markets, with US hiring picking up while Canada's job market lost more ground.
JOLTS Job Openings (how many jobs US employers are trying to fill): openings rose to 7.5 million in September, well above expectations.
US Nonfarm Payrolls and Unemployment Rate (jobs added, and the share of the workforce looking for work): the US added 165,000 jobs in October and unemployment dipped to 4.1%.
Canada Unemployment and Participation Rates (the share of workers looking for work, and the share of adults working or looking): unemployment rose to 6.7% as employment stalled.
THE FULL DETAILS
US Job Openings Climb Back to 7.5 Million

Job openings rose by 333,000 to 7.5 million in September, far above the 7.1 million economists were expecting, and the highest level since May. Workers noticed, with quits jumping to 3.4 million as more people felt confident enough to leave for something better.
Hires: 5.4 million, up 131,000, led by accommodation and food services
August revision: openings revised up 111,000 to 7.2 million
Total separations: 5.3 million, a 3.3% rate
Biggest industry gain: state and local government openings, up 104,000
US Hiring Beats Forecasts by a Wide Margin


Nonfarm payrolls rose by 165,000 in October, more than double the roughly 70,000 economists expected, while the unemployment rate slipped to 4.1% from 4.2%. Professional and business services and health care did most of the lifting, adding a combined 112,000 jobs.
Revisions: August and September revised up a combined 84,000
Average hourly earnings: up 0.4% to $38.00, 3.1% higher than a year ago
Manufacturing: up 19,000, led by computer and electronic products
Participation rate: 61.9%, little changed
Canada's Unemployment Rate Rises for a Second Straight Month


The unemployment rate rose to 6.7% in October from 6.5%, as employment was essentially flat with a loss of 4,700 jobs against expectations for a gain of about 15,000. The participation rate held at 64.8%, and the weakness sat in the private sector, which shed 53,000 jobs while public sector hiring added 50,000.
Youth unemployment: 13.7%, up 0.7 points
Average hourly wages: up 2.2% from a year ago, down from 2.3% in September
Job-finding rate: 18.9%, down from 19.8% a year earlier
Hardest-hit industry: wholesale and retail trade, down 29,000 jobs
TOP INSIGHTS
Canada's Jobs Report Weakens the Case for Another Rate Hike
In last week's Pulse, I said I expected the Bank of Canada to raise rates at least once more, and that Friday's jobs report would be instructive. Well, it was. Canada has now lost jobs two months running, mostly at private businesses, while the US keeps hiring broadly enough that earlier months get revised up.
After Friday's report, the markets wasted no time to reset the odds of a January Bank of Canada hike, which fell to 77% from 96%, according to TD. The Fed still looks set to tighten in December.
With this latest data in hand, my view has shifted. The markets are still leaning toward a January hike, but it now looks more likely that the Bank of Canada holds in December and may stay there for a while. That would widen the rate gap with the US and leave the Canadian dollar exposed.
Strong Hiring Makes a December Fed Hike Harder to Avoid
The US job market still isn't cooling the way many expected. October's gain was more than double the average monthly pace of the past year, and job openings and quits both rose, so it looks like employers still want workers and workers know it.
CME's FedWatch tool now puts the odds of a December hike at 76.8%, up from about 70% before Friday's report. Higher rates weigh hardest on expensive growth stocks, which is exactly where Thursday's sell-off hit.
So it looks more likely than not that the Fed raises rates on December 9. Next Tuesday's inflation report is the main thing that could change that, and with no official yearly rate this month, a monthly core reading of 0.3% or higher would all but settle it.
Hiring Is Leaning on Health Care and Government
Jobs reports both north and south of the border share a pattern: the hiring is coming from parts of the economy that don't rise and fall with the business cycle. US gains were led by health care and professional services, job openings leaned on state and local government, and in Canada only the public sector grew.
That makes the headlines look stronger than the real-life conditions for most job seekers. For investors, the sectors adding jobs aren't the ones that drive consumer spending and corporate earnings.
Public payrolls follow budgets rather than demand, so they can only carry a job market for so long. It looks likely that private hiring outside health care stays soft into the new year, which should leave both job markets weaker underneath than the headlines imply.
THE WEEK AHEAD
US Inflation Rate and Core Inflation Rate for October are released Tuesday, with economists expecting prices to rise 0.3% for the month and core prices to rise 0.2% to 0.3%, which would put unofficial yearly estimates near 3.7% and 2.6%. There's a wrinkle this time: because the 2025 government shutdown wiped out October 2025 price collection, the BLS won't publish official 12-month rates for overall or core inflation, so markets will depend more on the monthly numbers.
Sponsored by

Bad news is good business. We never bought in.

Every morning, financial news follows the same script. Headlines panic, coverage catastrophises, and somewhere inside the noise is the story that actually matters — the one that tells you where the opportunity sits, not just where the fear is pointing.
Most sources have stopped looking. The alarm is easier to sell.
The Daily Upside was created by Wall Street insiders for readers who crave real insight over recycled anxiety. Five minutes of global business and finance, before the noise sets the agenda — just the facts, context, and analysis your decisions need.
Join 1M readers — including managing directors and principals at some of Wall Street’s largest institutions — who trust The Daily Upside to filter through the chaos.
The upsides are always there. We’ll find them before breakfast.
TOP STORY | FEDERAL BUDGET
Carney Spends the Oil Windfall on Sovereignty

C$142 billion in new spending planned over five years
Deficit tops C$50 billion with no path to balance
C$11.2 billion over four years targets ending homelessness
C$2.7 billion aims to give Canada rocket launch capability
All Canadian eyes were glued to screens Thursday afternoon, as Ottawa tabled a budget built around making Canada less dependent on the United States, made possible largely by oil revenue that came in well ahead of plan. Prime Minister Mark Carney's second budget, titled Masters of Our Destiny, pairs that sovereignty push with housing money and a bigger grocery benefit for low- and modest-income families. Tariff-hit sectors get targeted help too, including C$6.5 billion for forestry.
Sovereignty Is Now the Organizing Idea
Beyond rockets, the plan puts C$2.3 billion into a marketplace for Canadian-made drones and exempts income from original artistic works from tax. Carney called it the next big step toward a more independent, more sovereign country.
The Windfall Has to Last
As we just saw in the economic update above, Canada's job market is losing ground, and this budget counts on oil revenue staying strong. A danger is that if crude falls back from its war-driven highs, the gap between Ottawa's ambitions and its revenue could widen quickly.
Full story here.

THIS WEEK’S POLL
This week’s Canadian budget depends quite a bit on diversification as the long-term answer to US tariffs, and Ottawa admits the shift will take time because of how deeply the two economies are tied together. Since March 2025, the government has set aside nearly C$44 billion to help workers and businesses hit by those tariffs. Assuming it does actually work, how long do you think this transition will take. Please vote on this week's question:
How long will it take Canada to cut its reliance on US trade in a significant way?
LAST WEEK’S POLL RESULTS
In last week's poll, I asked who should be responsible for protecting crypto investors, and the vote split almost evenly: 36% said the exchanges themselves, another 36% said investors themselves, and 28% pointed to governments and regulators. It looks like this community leans more toward platform and personal accountability over public oversight, and I fall squarely into that camp as well. Thanks to everyone who voted.

READER COMMENTS
Exchanges Bear Responsibility
“If the exchanges offer to store your coins and guarantee safety, then they should honour their word. But for ultimate security, keep it stored on a memory stick.” — storierod
“I think it should be 'the exchanges themselves' (which I chose) or 'investors themselves,' depending on what happened. Failure to supervise, breach of duty or things like that should be the exchanges' responsibility, but things like a self-inflicted compromise or falling prey to a scam should be the investor's responsibility, IMO.” — callawayguy
Investors Own the Risk
“Not the government or any institution that involves any cost to the public (especially me!), however indirect that cost is. Crypto is gambling, and if you gamble, your losses and gains are all on you. The exchanges lost the money, but I expect they have enough lawyers and accountants to somehow shift any costs they have to pay quietly over to the public.” — mrrobpog
ELECTRIC VEHICLES
Tesla Parks the Cybertruck to Build Robotaxis

Cybertruck production wind-down in Austin begins around mid-2027
Tesla and SpaceX fell more than 12% after midterms
Musk's net worth dropped $113 billion in two days
Musk once guessed 500,000 Cybertrucks a year; sales fell short
Elon Musk announced this week that Tesla is winding down production of its most polarizing vehicle, and the move says a lot about where he is taking the company. The Austin factory, the only plant building the truck, will shift toward the Cybercab, a two-seat robotaxi with no steering wheel or pedals. It caps a rough week for Musk, whose nearly $500 million in midterm campaign contributions backed the losing side.
Selling Cars Is Becoming a Side Business
An interesting trend we’re seeing is a big move to a broader product line. Tesla already halted Model S and Model X production in California to make room for its Optimus humanoid robots. Musk says the Cybercab will eventually outnumber all of Tesla's other vehicles combined, so it’s obvious that robotaxis and robots are now the main event.
Robotaxis Still Have to Prove Themselves
So far, the robotaxi service runs in just seven cities across Texas and Florida, behind Alphabet's Waymo, and Tesla hasn't disclosed its revenue or profit. With humanoid robots not yet for sale either, Tesla is trading a real product for two largely unproven bets.
Full story here.
US JOBS
Strong Jobs Report Hides a Longer Search

Average unemployment spell topped 27 weeks in October
About 2 million Americans jobless for at least 27 weeks
Long-term unemployed hit 27.6%, highest share since late 2021
Most government unemployment benefits run out after 26 weeks
As I noted in the economic update above, the headline US jobs numbers looked strong, but people who've lost work are having a tough go of it. Companies are holding onto staff while adding few new hires, so the jobless wait longer for their next role. Outside the pandemic, searches haven't run this long since 2016, and long stretches out of work drain savings and lower future earnings.
The Sidelines Can Become a Trap
Richmond Fed researchers warned that time out of work can itself make a job harder to find, as skills fade, networks thin and employers read long gaps as a red flag. It also helps explain why jobless claims look so low, since many of these workers have aged out of benefits.
Layoff Headlines Could Tip the Balance
Layoffs hit their lowest level in more than a year in September, but high-profile cuts at Disney and American Express could shake worker confidence. If the low-hire pattern meets a fresh wave of job cuts, the long-term unemployed pool could grow faster than the headlines show.
Full story here.
RETAIL INVESTING
Trump Media Shareholders Count the Damage

Outside investors have lost over $2.2 billion, per Reuters
Trump's 114.75 million shares remain worth about $460 million
Shares are down 32% since Tuesday's midterm elections
Revenue has been flat near $4 million a year
Retail investors who bought Trump Media as a bet on a second Trump presidency are sitting on deep losses, but perhaps not surprisingly, the president's own stake, received without paying cash, is still worth a fortune on paper. Shareholders Reuters spoke with described savings and retirement plans hit hard, including a Colorado nurse facing a loss of about $28,000. The company disputes the Reuters math and points to a planned merger with fusion energy firm TAE Technologies.
Belief Hasn't Matched the Balance Sheet
Trump Media spent more than $200 million building its Truth Social streaming service, which brought in just $630,000 in revenue through June 2026. Many shareholders blame naked short selling, but Reuters found no evidence of it and short interest sits below average.
A Brand Tied to One Man's Popularity
The company's own filings warn its brand could lose value if the president's popularity falls further, and his approval ratings have reached record lows. With Democrats taking both chambers of Congress, the political tailwind these investors counted on looks weaker heading into 2027.
Full story here.


Ottawa aims to simplify taxes, addressing corporate loss transfers and preferred shares

Joly asks Competition Bureau to probe comments from Cliffs CEO about Stelco acquisition

Why the US midterms sparked an AI stock selloff

Drunk and dangerous e-bike riders face on-the-spot fines under crackdown
Berkshire Hathaway buys back $9.6B of its own stock but profits decline
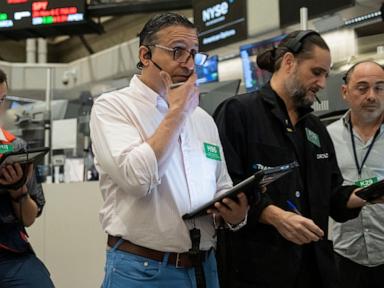
From high-flying AI stocks to tariff-hit alcohol companies, the midterms shook up Wall Street

Click any stock ticker to explore its page on Blossom Social. Review key financial data, learn more about the company, explore earnings information, and see what other investors in the community are saying.
Top 10 Weekly Gainers
US and Canadian stocks over $10B market cap, 5-day price change as of November 6, 2026. Prices shown in the currency of the listed exchange (CAD for TSX; USD for NYSE and Nasdaq)
Ticker | Company | Exchange | Price | 5-Day Change |
AppLovin Corporation | NasdaqGS | $391.22 | +71.2% | |
Unity Software Inc. | NYSE | $51.49 | +36.6% | |
Nextpower Inc. | NasdaqGS | $104.89 | +32.2% | |
Grab Holdings Limited | NasdaqGS | $3.41 | +25.8% | |
Fiserv Inc. | NasdaqGS | $62.88 | +25.7% | |
G Mining Ventures Corp. | TSX | $47.36 | +25.1% | |
Medline Inc. | NasdaqGS | $39.67 | +23.5% | |
IAMGOLD Corporation | TSX | $26.44 | +22.8% | |
Procore Technologies Inc. | NYSE | $75.30 | +22.7% | |
IDEXX Laboratories Inc. | NasdaqGS | $676.04 | +22.7% |
Top 10 Weekly Losers
Ticker | Company | Exchange | Price | 5-Day Change |
Lumentum Holdings Inc. | NasdaqGS | $538.59 | -35.9% | |
Seagate Technology Holdings plc | NasdaqGS | $460.99 | -28.5% | |
Marvell Technology Inc. | NasdaqGS | $141.20 | -28.1% | |
Western Digital Corporation | NasdaqGS | $263.78 | -28.0% | |
Sandisk Corporation | NasdaqGS | $835.06 | -27.4% | |
Axon Enterprise Inc. | NasdaqGS | $313.00 | -26.8% | |
Astera Labs Inc. | NasdaqGS | $190.71 | -26.3% | |
Fidelity National Information Services Inc. | NYSE | $28.73 | -25.5% | |
Natera Inc. | NasdaqGS | $310.60 | -25.0% | |
Dynatrace Inc. | NYSE | $43.44 | -24.7% |
Most Overbought
US and Canadian stocks, Relative Strength Index as of November 6, 2026
Ticker | Company | Exchange | Sector | RSI |
ADT Inc. | NYSE | Consumer Discretionary | 86.7 | |
Veralto Corporation | NYSE | Industrials | 84.0 | |
Procore Technologies Inc. | NYSE | Information Technology | 83.3 | |
Fiserv Inc. | NasdaqGS | Financials | 82.4 | |
Bentley Systems Incorporated | NasdaqGS | Information Technology | 80.0 | |
AerCap Holdings N.V. | NYSE | Industrials | 79.2 | |
StandardAero Inc. | NYSE | Industrials | 79.1 | |
Yum China Holdings Inc. | NYSE | Consumer Discretionary | 78.9 | |
Extra Space Storage Inc. | NYSE | Real Estate | 78.3 | |
Hydro One Limited | TSX | Utilities | 78.3 |
Most Oversold
Ticker | Company | Exchange | Sector | RSI |
Dynatrace Inc. | NYSE | Information Technology | 20.0 | |
Caterpillar Inc. | NYSE | Industrials | 21.1 | |
F5 Inc. | NasdaqGS | Information Technology | 21.4 | |
Alnylam Pharmaceuticals Inc. | NasdaqGS | Health Care | 21.8 | |
Texas Pacific Land Corporation | NYSE | Energy | 22.4 | |
Fortinet Inc. | NasdaqGS | Information Technology | 23.1 | |
Archer-Daniels-Midland Company | NYSE | Consumer Staples | 23.1 | |
Western Midstream Partners LP | NYSE | Energy | 23.6 | |
Cummins Inc. | NYSE | Industrials | 23.8 | |
Madrigal Pharmaceuticals Inc. | NasdaqGS | Health Care | 23.8 |
The Relative Strength Index (RSI) can provide a signal that suggests a stock is either overbought or oversold.
📈A stock that has an RSI over 70 is considered to be in “overbought” territory. This might suggest that the stock is due for a pullback, however it is not a recommendation to sell.
📉A stock that is trading with an RSI below 30 is considered to be in “oversold” territory. This might suggest that the stock is due for a recovery, however it is not a recommendation to buy. Always perform your own due diligence.
Stay connected with The Pulse

